Friday, April 17, 2020


Long time since I last contributed to this blog. With more time for mediation and reading, I feel the need to write as I m developing (again!) an investment thesis that seems not to be aligned with most investors - (probably the lockdown is indeed driving me insane ;)


My main objective is to safeguard my mind against any bias (typically coming from my current PnL  and positioning, quite long risk since mid March) and stay fully objective. Festinger used to say " people coginze and interpret information to fit what they already believe". Meditation and writing down thoughts as you know, helps to keep the mind centred and independent.

I continue to send out to 1-2 times a year a macro slide deck focused on inflection points when I potentially see them. As usual, I focus on divergences between rate of change in macro data (eco growth/liquidity) and investors' positioning (cross assets, cross strategies) which, in my opinion, lead to the largest and most asymmetric moves.

The last macro slide deck I shared with my colleagues was in early January when global growth was decelerating while positioning in risk assets was significantly uber-long. Conclusion was that any negative news breaking out could trigger large liquidations.

I've positioned portfolios more defensively around mid January. Frustrating at first, but this ended up helping me to capitalize on recent market volatility with full objectivity and dry powder. Let's be clear, I did not expect the extent of the sell of nor anticipated the virus outbreak.

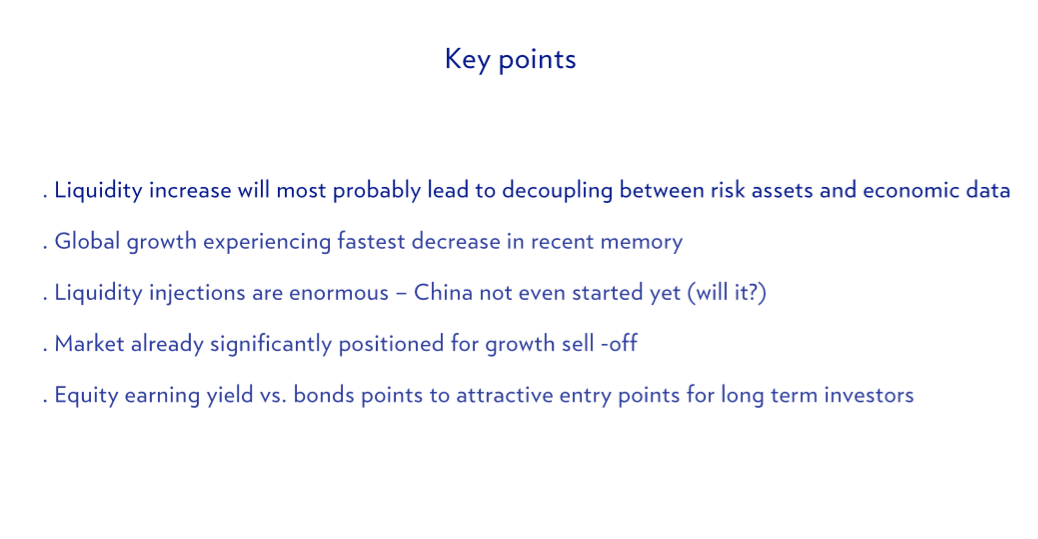
I m copy/pasting below the slides of a short macro deck I sent out toward the end of March. It is a bit of a particular one as the attractive inflection point was much more asymmetric 10 days ago. Nevertheless, positioning is still quite defensive or short across hedge funds, systematics funds and across assets (vol, FX).

Economic macro momentum data are pointing to continued deterioration, but the negative rate of change is fading (bit like the "second derivative" growth story of late 2008), liquidity is surging like never before with phenomenal rates of changes. MMT which i so much wrote about in my early posts will finally be adopted….

But more importantly, COVID-lockdown shock is transitory by nature. This is not a classic recession! the macro here is much simpler than in a normal recession: Simply put, economies in lockdown: GDP down big, economies not in lockdown: GDP rebound big! 
As the lockdown stops, the global economy will rebound as fast as it came down. Moreover, despite the fact that we are experiencing a "technical" lockdown led recession - Central banks response has been a. coordinated, b. much faster than in previous crisis/recession and c. substantially larger in size - stimulus size never seen before
Finaly the private sector in G7 is not leveraged like it is always in recessions. This means that the private sector does not have to restructure its balance sheet to spend again. Watch out for a big rebound in private sector spending as the commodity shock and fiscal stimulus add further fuel!

So here the inflection point is optimal for long term investors. I see a potential sea change in investors appreciation for risk assets vs defensive assets as liquidity injection will most probably be way above what would have been required...

I let you take a look at few of these simple slides, but in a nutshell the message is : investors should expect financial markets to disconnect from economic growth data and be influenced mainly by liquidity.  It will be a very challenging environment for fundamental investors as they can not properly modelise future potential earnings stream as macro data goes down and stay extremely volatile. Investors will most probably continue to model the current "technical" recession in perspective with typical recession- again this is not the case!

It will contibute further to upside price inertia as investors go back long risk only step by step as they try to rationalize the up move. We could see risk assets at much higher level at year end while economic growth will be subdued at best. Most investors are not positioned yet for such a scenario.


Good luck trading


Sunday, November 12, 2017

Oil bears - beware

Did have time to publish for some time as working a PM for multiassets UHNW accounts - here s a suite of slides I ve produced this summer for a bull call on Oil - found that the trade is quite asymetric.
More importantly benefit from macro, micro and positioning supporting factors, typically the configuration that lead to powerfull moves.

The background was to try to find what could move upward investors inflation expectations - well we probably found one of the factors----


The title of the research piece is called "Crude Bears bewares". BB screenshots are from August but the theme is still very much fresh. I v added a selection of slides - but cover the key points.


Conclusions are

  • Oil demand is as strong as ever with EM driving a large part of the growth - EM cyclical upswing will only reinforce it 
  • US inventories (laggging indicators as cheapest place to stock) are declining fast - should converge soon twrd 5 years average 
  • 2014 bear forced E&P to cut significantly capex : will be challenging to add production growth 
  • US shale oil = only growing suppply BUT seems to be already past its peak in term of MB/D of growth (rig productivity going down fast)
  • The US oil production likely to peak soon as a result  
  • Oil price should increase in the next 12 months to reflect supply/demand imbalances 
  • It will contribute to increase inflation expectations of investors in the US which is probably what the FED wants before raising rates i.e behind the curve, on purpose 
  •  
  • Therefore a long crude/energy equities (ex-shale) should be an interesting exposure to balance long duration exposure of traditional multi asset portfolios  
  • Suggest a mix of crude futures, XOP US Equity, OIH US Equity and Stoxx 600 Oil Explo.


Sunday, January 3, 2016

2016 top trades - 12m


Investors sentiment is extremely depressed on the back of the "China deflation trade" with the most cyclical assets trading for some of them at 2009 levels.

What would I need to go long EM assets ? 

Tactical:
1st: Price of EM equities market to start trending up for initiation of 1/3 of long tactical position at an asymmetrical point (correction after small uptrend and close to recent lows)
2st: Key "economic visible indicators" to start losing negative momentum
3st : light positionning cross assets/strategy

Increase in potentially strategic long:
3st : fiscal stimulus + additional eco data to print green numbers: PMI, current account etc..so that it can convince long term investors to accumulate and as a result sustain the uptrend

Why looking at it now ?

Well, EM markets not accelerating in down move any more after significant double digit losses, the most leveraged representation of China bubble is going almost bankrupt (Glencore) -  EM FX crosses are devaluating across the board and stop accelerating and central banks are injecting liquidity - at some point, it will have an impact on macro data. 

Moreover, as a starter, economic growth and financial conditions are not all at the same level and speed in EM which is a different context that the one of the last decade. Investors seems to focus on China PMIs which seem to be the only "fast and easy and reliable " over there, but actually there is a bunch of other indicators such as real estate prices, business confidence, service PMI that shows that all is not so dark in China. The Chinese Government is trying to deflate post-crisis bubble without too much crashing the economy and we should not expect an easy ride.

Across the EM world - except Brasil - Central banks are accelerating the easing of financial conditions (RBI this morning) to counter falling inflation rates and reduced economic growth.
This is one positive development for economic growth and ultimately risk assets. Additionally, FX is devaluating fast against DV world which is also a positive for both GDP growth and financial conditions.

While most Central banks seems to act against current negative cyclical forces (except Brasil - again..), economic growth is not yet kick starting.

My prefered beta to this story : China and Brasil equities. I m going small net long now.

The best beta to "China Inflation" trade... will be EEM. Stay tuned.
 

Monday, December 14, 2015

HYG close to capitulation

HYG price action points to short term capitulation - look for bounce from these level and re-test close to recent lows to offer asymmetrical entry point - risk/reward

Macro backdrop could support risk assets in the short term following FED meeting: following significant credit spread widening in the US, if Yellen increases the target ranger from 0-0.25 to 0.25-0.5 she will most probably be quite dovish - should be supportive of a Christmas rally especially in the current price action environment.

Once the market rebounds, it will be interesting and key to assess how the "target range" system which differs from the post-crisis "target rate" works - indeed, with USD 2.5tr in reserve, the FED might be forced to set up RRA with commercial banks in order to sock up liquidity and manage accordingly the range - hopefully it will not be a problem...

Monday, August 24, 2015

Markets Turbulences are creating huge buying opportunities in US (and EU)

One charts explain it all again : Spread of US BBB spreads vs Phily Fed is at highest since 2009 on the back of recent de-risking + supply is hitting historical high before expected rate hikes. Seems quite bullish to me !


EU charts in next post. 
 

Friday, August 21, 2015

Time to reconsider Brasil and BRL


The asymmetry in being short BRL against EUR (4.2) or USD (3.7) is not there anymore (see my thesis there with details there : http://factualmacro.blogspot.ch/2014/08/short-brl-charts-only.html ) - As a starter, one simple chart support my view - see below : the current account deficit is closing at a rapid pace. There is still significant room to improve - as most of the move is due to reduced imports and current account /GDP is still at a wide -4% - to help the external sector to actually contribute to GDP growth but nonetheless this is a much welcome development that will resonate with the investor community, especially non BRL denominated investors.


Moreover,  inflation is topping out and as a result, long BRL Fixed Income is should be a good play @ approx. 12% carry and potential price appreciation and BRL appreciation.

Clearly, industrial production and output gap are at 2009 lows, credit is being tightened big time and fiscal tightening is at his highest since 2002 - there is basically no oil in the economic motor and the gov.is trying to squeeze it even more...So macro data are definitely not rosy!  But I believe, after the recent China related fears, most of these info are in the prices of BRL and brazilian equities.

Interesting opportunities in Brazil equities should arise in the months to come with another potential catalyst being China stimulus. As investors are digesting China devaluation, we should expect some volatility down the road, but I believe this is a good time to slowly start building select exposure in Brazil. Factually, we need prices and macro to back our thesis before going in in size.

Now, on a FACTUAL basis, prices are not telling us to change positioning for the time being - but
I would recommend to cut short BRL exposure and start building small exposure in BRL denominated equities with beaten down non-cyclical sectors such as a Telco basket (TIM + Vivo for ex). While it might be too early to look at cyclical stocks, it make sense to start screening for the middle part of the smile in term of gdp beta such as supermarket (Lojas Americanas), few banks such as Bradesco, few local cyclical plays such as GOL Linha Aerias.

As China economy is decelerating fast (last PMI @ 47, 6 months in a row below 50) with inflation well below the 4% upper limit, the probability of monetary and more likely fiscal stimulus is increasing fast. We should also expect much more FX devaluation (20% should be a good start).


Any hint of stimulus in China should also help lift Brazil cyclical sectors. If such a scenario occurs, extremely beaten down global cyclical plays such as FCX (which recently announced that it will raise equity..) could be very interesting, especially after the current market correction.

Let s now wait context for market prices to change so that it help the trade logic resonate with investors.

Stay tuned


Tuesday, June 23, 2015

Today s EU Macro data continue to support bullish positioning - all stars are aligned..

Higher than expected and continued rebound in growth + historical ease in financial conditions + recent sell-off on Grexit noise = all stars are aligned


Friday, June 19, 2015

Grexit is for sheep and sheep get .....

Why Grexit will not happen :

1. Political dimension:  A Greece exit, i.e a return to the drachma, a default on its EUR denominated debt and more importantly a return back to monetary and fiscal sovereignty will - after probably a difficult period of 12-18 months - trigger a huge economic rebound (as it was the case for example in EU in Island). As a result, anti-EU parties across Europe will gain significant credibility and the "farce" of Troika' forced auterity will be totaly discredited. So politically this is simply not possible for the Troika - the current game-theory driven negotiation are only a staged act for the media/population. If markets could correct a bit more before the final outcome, the Troika/Grece Gov. could be even more happy has their "TV-novela" will be more credible and they will on top of that be considered as "hero" once they find a deal and market rebound as a results.

2. Financial dimension: just look at this charts, which is Greece loans to deposit ratio - this leveraging is made mostly with ELA (Emergency Liquidity Assistance)....- so if they default or exit...this is the double whammy for EU central banks that need to honor payment via Target. That s also explain why the ECB is keen to save Greece from default and exit illustrated by EUR 90bn in loan from ECB vs EUR 44bn in assets.


Monday, February 23, 2015

USDBRL Update

USDBRL went from 2.25 to 2.87 (approx +27% in 6 months) as of today since my last post - I continue to believe that this is only the beginning of this uptrend as macro data continue to deteriorate at a rapid pace - and in all fronts! So far no counter cyclical measure from the Gov - and we should not except any I guess...

The theme is starting to get audience as the uptrend in the USDBRL price is clearer, macro data are getting quite ugly and election are done - this should help the trend to accelerate in the near future.

GS started to become bearish on the USDBRL in Q4 2015 - Below a macro update from GS:

Business Confidence Business confidence in the industrial sector declined a sizeable 3.1% mom sa in February, more than fully erasing the 1.9% mom sa increase recorded in January. Business confidence in the industrial sector is currently 22% below the January 2013 peak.

The index measuring current conditions declined 1.7% mom sa in February and the index measuring expectations fell a large 4.8% mom sa. The rate of capacity utilization remained unchanged at 82.0, i.e., below the 84.6% print from a year ago.

Weak confidence in the industrial sector attests to the very challenging near term operating environment. Industrial production has now declined for six consecutive quarters and it is should retrench further in 2015 as it continues to face strong headwinds from a still overvalued BRL, high levels of inventories, depressed confidence, high unit labor costs, poor infrastructure, rising energy costs, a high (and rising) tax burden and weak external demand (particularly from Argentina for durable goods).

Furthermore, financing conditions are expected to tighten in 2015 as lending rates go up and access to credit becomes more selective (from both private and public banks). Finally, investment spending is likely to contract again in 2015 given the poor outlook for final demand growth, higher financing costs, growing risk of energy/water supply limitations, and likely significant cuts in capex by Petrobras owing to the legal and corporate governance issues.

According to the Central Bank’s weekly survey of market analysts, inflation expectations for year-end 2015 worsened, reaching a high 7.33% (+6bp from a week ago and +34bp from a month ago), and for year-end 2016 remained unchanged at an above-target 5.60%. That is, expectations for 2015 IPCA headline inflation continue to deteriorate, moving further away from the generous 6.50% upper limit of the inflation target band.

Inflation in February is expected to have been under upward pressure from higher fuel prices and school tuition fees and the residual impact from higher electricity tariffs and urban bus fares. This should be partially offset by the slight moderation of food inflation and the seasonal decline in airfares and clothing prices.

Overall, the current account posted a very large US$90.9bn deficit in 2014 (4.17% GDP; the largest current account deficit in 13 years), well above the US$81.1bn deficit (3.62% of GDP) recorded in 2013 despite a stagnant economy. FDI inflows moderated slightly: to US$62.5bn in 2014 from US$64.0bn in 2013; i.e., FDI financed only 69% of the current account deficit over the last 12 months, down from 120% in 2012 and 127% in 2011
FDI inflows reached US$62.5bn in 2014 but financed only 69% of the current account deficit over the last 12 months.

According to the monthly FGV Index, consumer confidence (CC) posted a large 6.7% mom sa decline in January. The overall consumer confidence index is now at its lowest level since the index started to be reported in September 2005. Furthermore, consumer confidence is currently 30.2% below the April 2012 peak and 22.2% below the average of the last five years.
Business and consumer confidence remains very depressed given the anticipation of policy tightening, rising inflation, higher taxes, significant increases in utility and transportation tariffs, deteriorating labor market conditions, and more exigent credit conditions. This poses major headwinds for private consumption in the coming months.

Consolidated Public Sector Primary Fiscal Balance (January); the consolidated public sector posted a very disappointing 0.63% of GDP primary deficit in 2014, down from surpluses of 1.9% of GDP in 2013, and 2.4% of GDP in 2012. This was the worst fiscal outturn in 16 years (since November 1998). The erosion of the primary surplus in recent years was driven chiefly by the weak fiscal numbers of the Central Government, whose primary balance declined from 1.55% of GDP in 2013, to a deficit of 0.40% of GDP in 2014.
The overall public sector fiscal deficit widened to a very high 6.7% of GDP (from 3.25% of GDP in 2013 and the highest fiscal deficit since August 1999) given the very high 6.1% of GDP net interest bill and steady erosion of the primary fiscal surplus.
Gross general government debt rose to 63.4% of GDP in 2014, up from 56.7% of GDP in 2013 and 53.4% of GDP in 2010 (the highest level since at least 2006).